Webhook logs
Review outbound webhook delivery attempts, filter by event and status, and inspect errors.
Open Webhooks → Logs.
What this page is for
Webhook logs record every outbound POST Kirisan makes to your saved HTTPS URLs — live traffic and test deliveries. Use this page to confirm deliveries succeeded, find failed attempts, and read HTTP codes and error text.
This is different from Webhooks → Test, which sends sample JSON on demand. Logs show what actually happened in production (and after tests).
Sample data shown.
Page intro
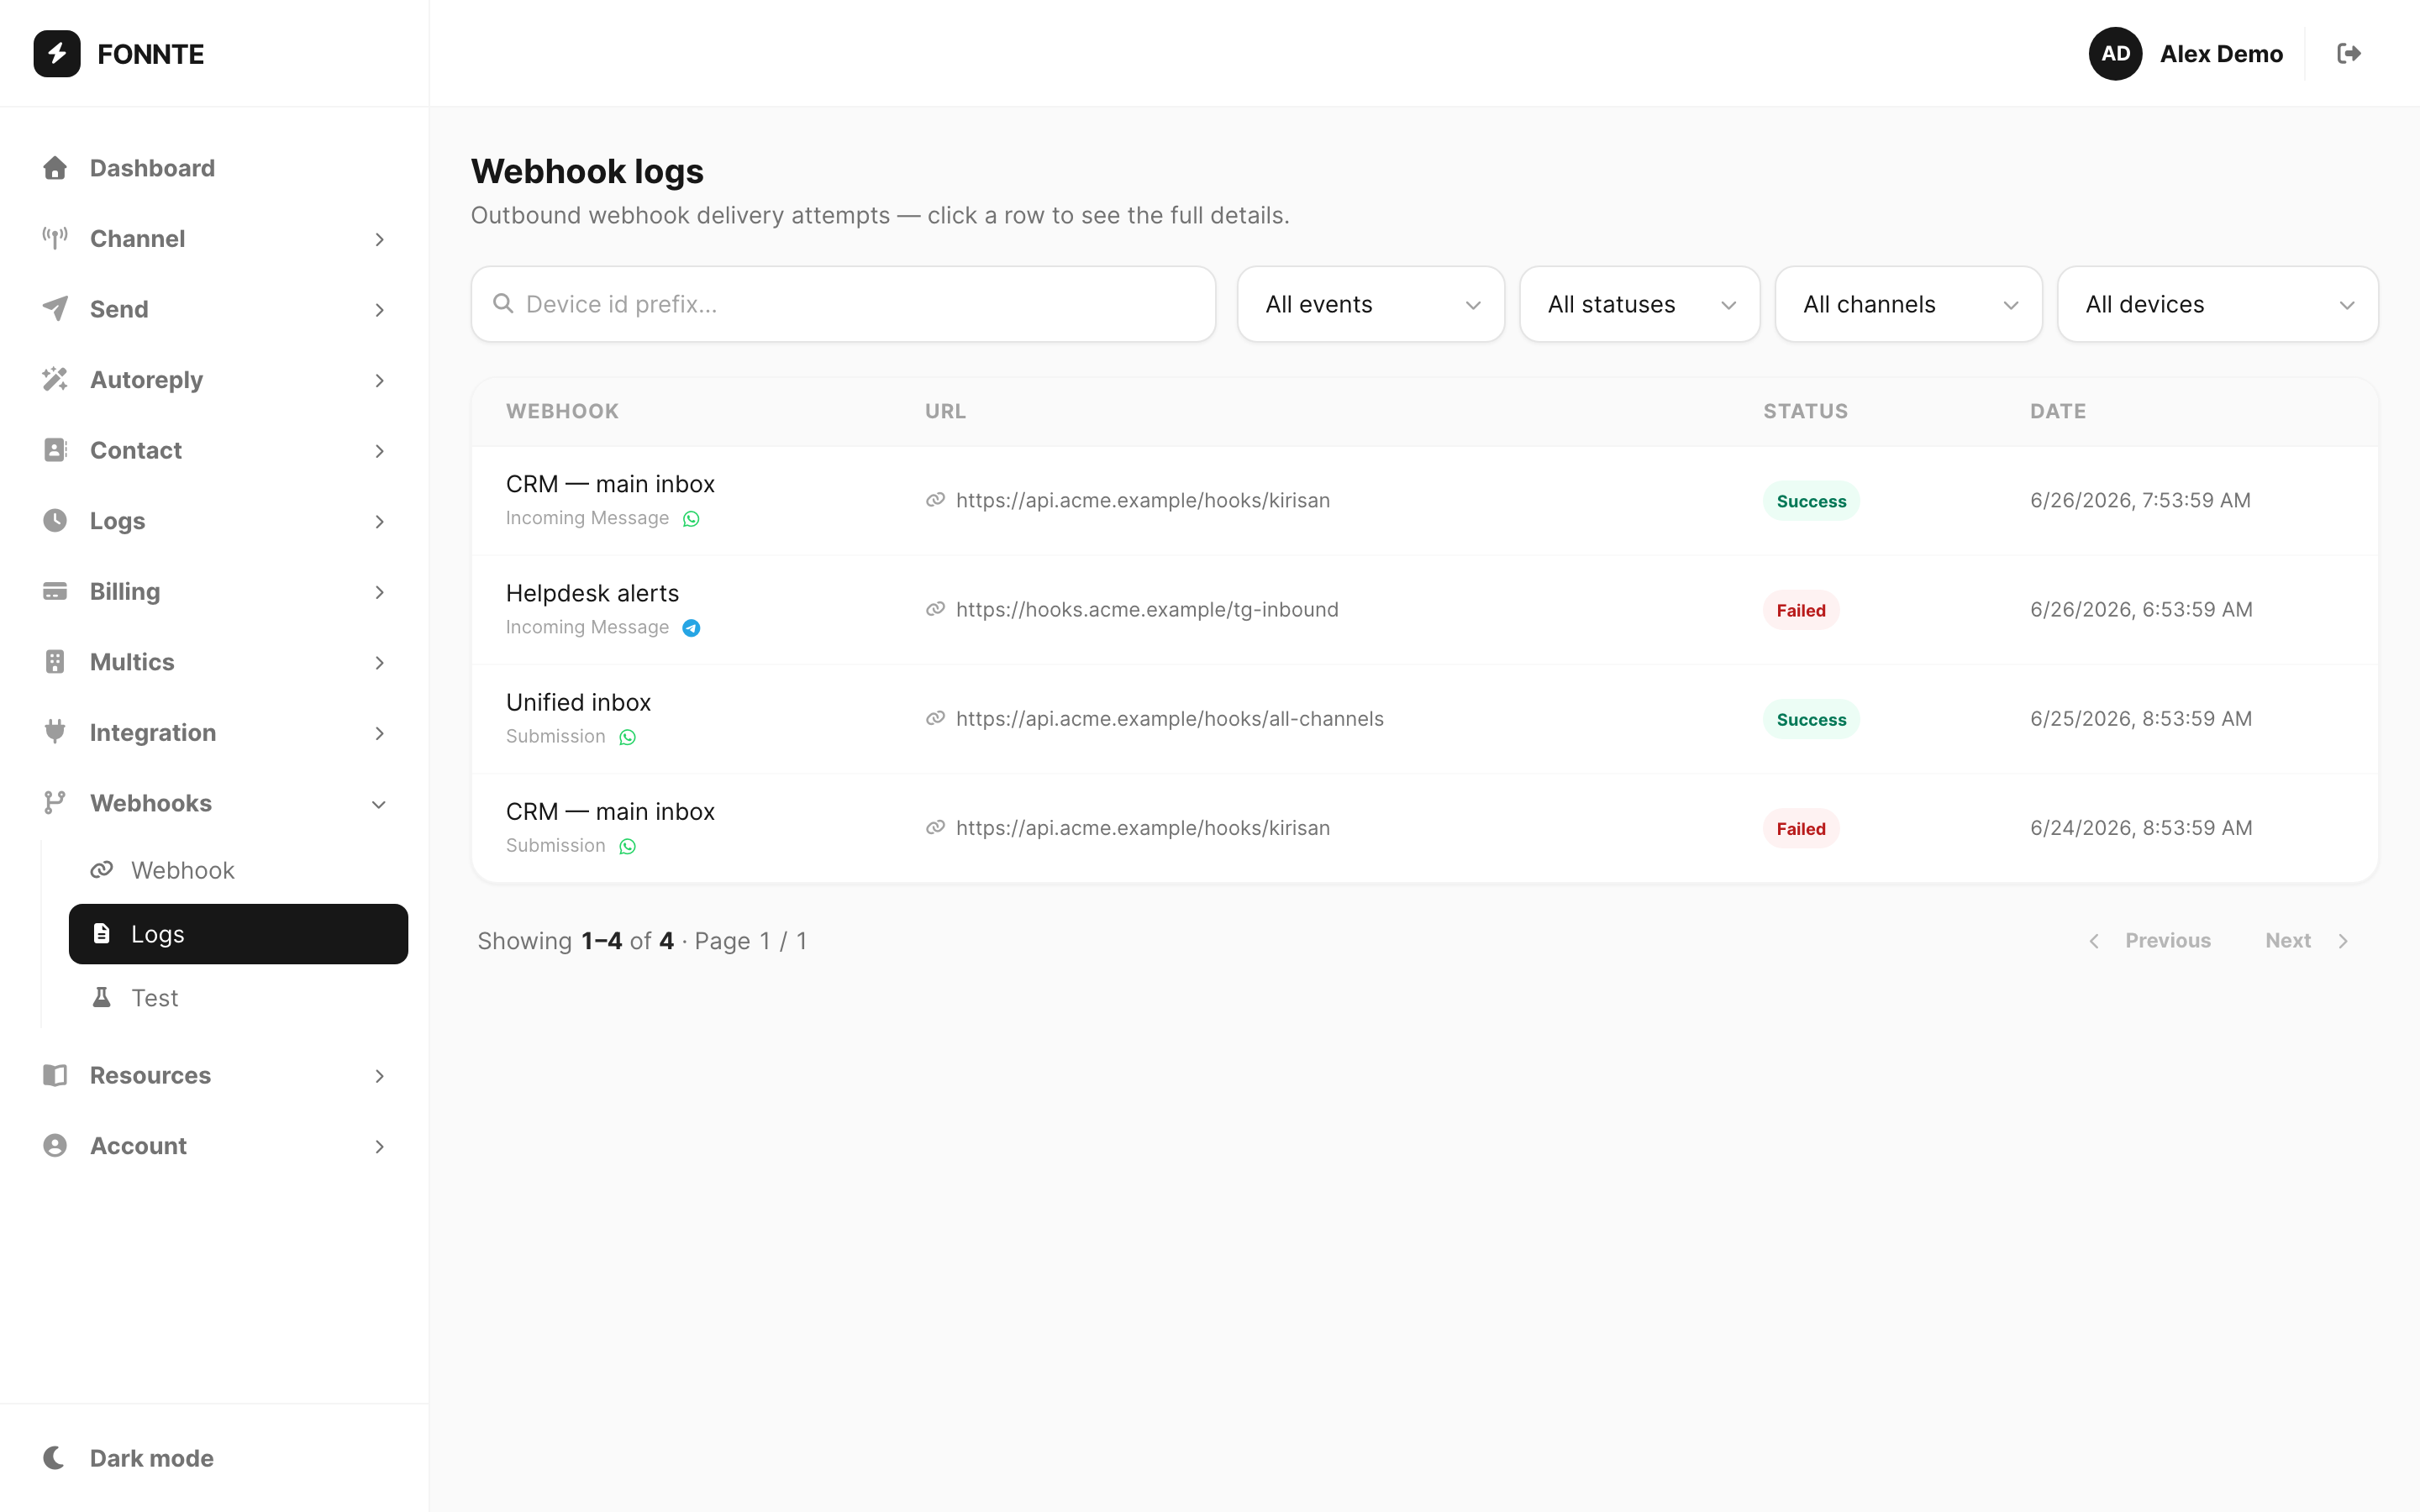
The subtitle explains the workflow: each row is one delivery attempt — click a row to open the full detail popup.
Filters and search
| Control | What it does |
|---|---|
| Search | Match device id prefix — type the start of a WhatsApp number, Telegram token, or WABA token (indexed search) |
| All events | Incoming message, Submission, or Submission completed — or show all |
| All statuses | Success or Failed — or show all |
| Channel | WhatsApp, Telegram, WABA, or Email — or all channels |
| All devices | Limit to one linked device from your webhook endpoints |
Changing any filter reloads the table from page 1.
Logs table
Each row is one delivery attempt to one endpoint:
| Column | Meaning |
|---|---|
| Webhook | Display name from Webhooks → Webhook |
| Subline | Event type (for example incoming message) and channel icon |
| URL | Destination HTTPS URL that received the POST |
| Status | success (your server returned 2xx) or failed |
| Date | When Kirisan sent the request |
Rows are clickable — Kirisan opens a detail popup with HTTP code, duration, device id, and error text when the delivery failed.
Sample data shown.
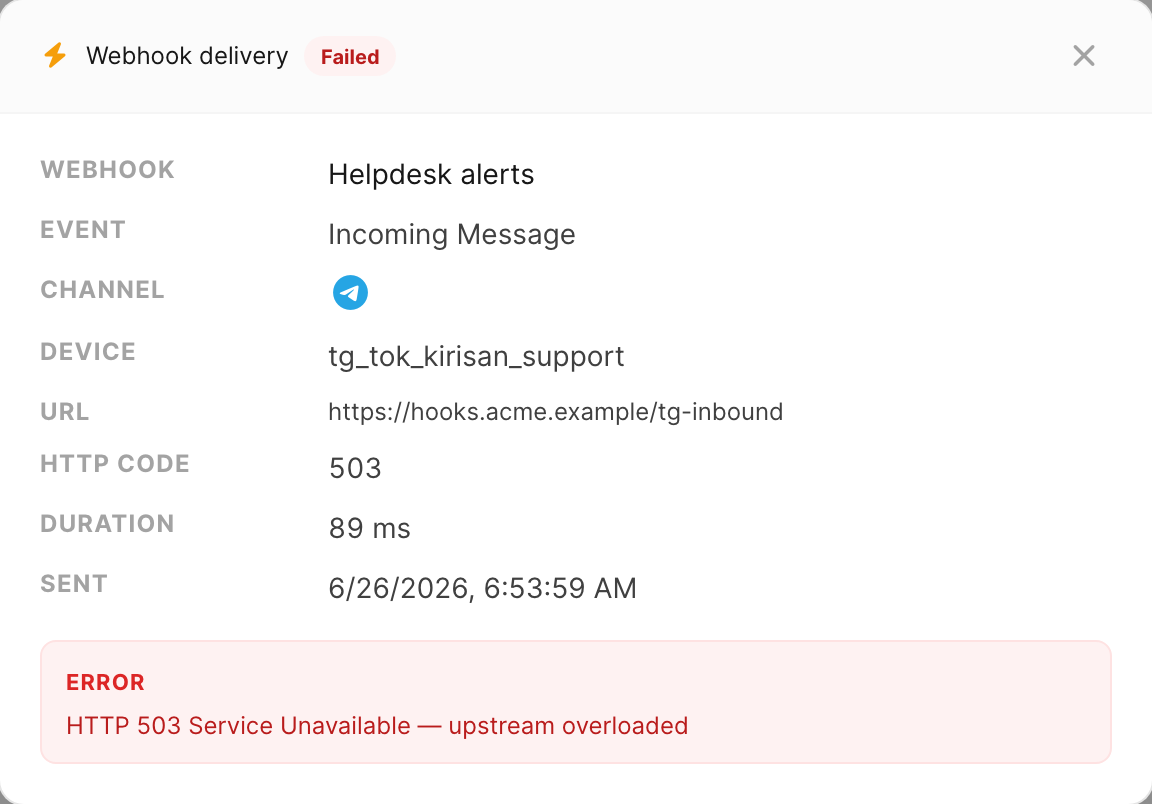
Detail popup fields
| Field | Meaning |
|---|---|
| Webhook | Endpoint display name |
| Event | Event type that triggered the POST |
| Channel | WhatsApp, Telegram, WABA, or Email |
| Device | Device token or number tied to this delivery |
| URL | Full destination URL |
| HTTP code | Response status from your server (empty when the connection failed before a response) |
| Duration | Round-trip time in milliseconds |
| Sent | Timestamp of the attempt |
| Error | Failure reason — timeout, connection error, or non-2xx response summary |
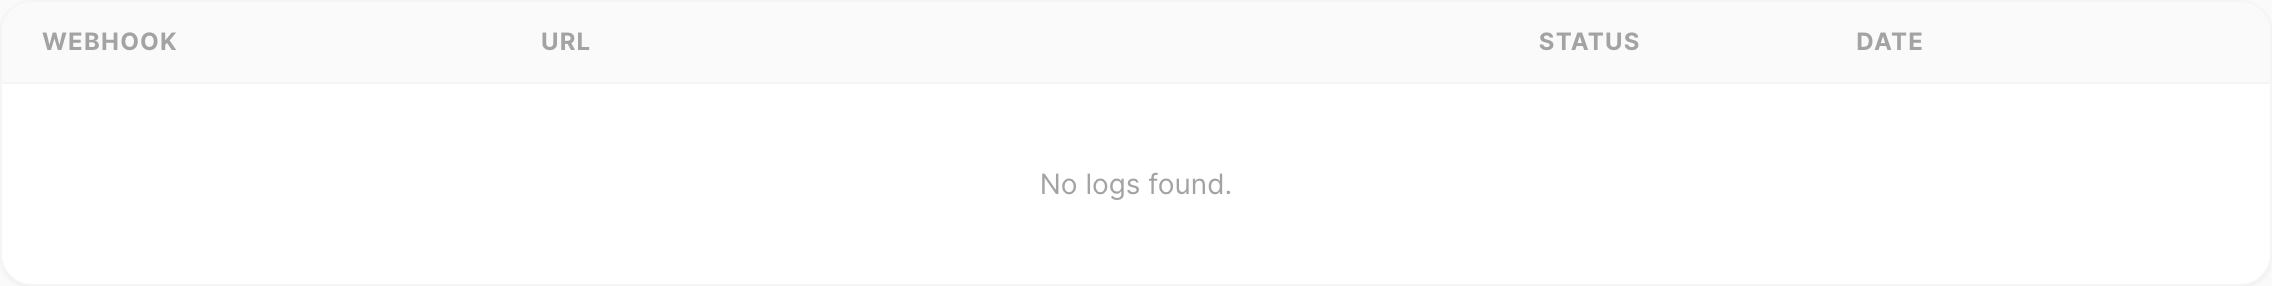
No logs yet
When nothing matches your filters — or you have not received any deliveries yet — the table shows No logs found.
Sample data shown.
Typical reasons the list is empty:
- No Active webhooks yet — complete Webhooks → Test first
- Filters are too narrow — reset All events, All statuses, Channel, and Device
- Live traffic has not hit a linked device since the endpoint went active
Success vs failed
| Status | Meaning |
|---|---|
| success | Your server responded with 200 or 201 within the timeout |
| failed | Non-2xx HTTP status, connection error, or timeout — open the row for Error text |
After a failed delivery, fix your server or URL, then wait for the next live event or run Webhooks → Test and check logs again.
Pagination
When you have many attempts, use pagination at the bottom (Showing range). The total count is capped for performance on very large histories — narrow filters if you need a specific device or time window.
Related
- Webhooks reference — configure endpoints and devices
- Test webhooks — send sample POSTs and activate pending endpoints
- Debug a failed delivery — step-by-step troubleshoot
- Run a webhook test — verify your URL before going live
- Resources → Variables — JSON payload reference