Statistics
Cross-channel send volume, delivery rates, and daily trends for WhatsApp, WABA, Telegram, and email.
Open Logs → Statistics.
What this page is for
Aggregated outbound activity across WhatsApp, WABA, Telegram, and email — totals, delivery and failure rates, daily trends, channel mix, and top WhatsApp send types.
Use History or a channel log for individual sends (recipient, message preview, error text). Statistics shows totals and trends for the time window you pick.
Sample data shown.
| Header control | What it does |
|---|---|
| Today | From midnight UTC today through now |
| 7 days | Rolling last 7 days |
| 30 days | Rolling last 30 days |
| 90 days | Rolling last 90 days |
Every card and chart on the page updates when you change the window.
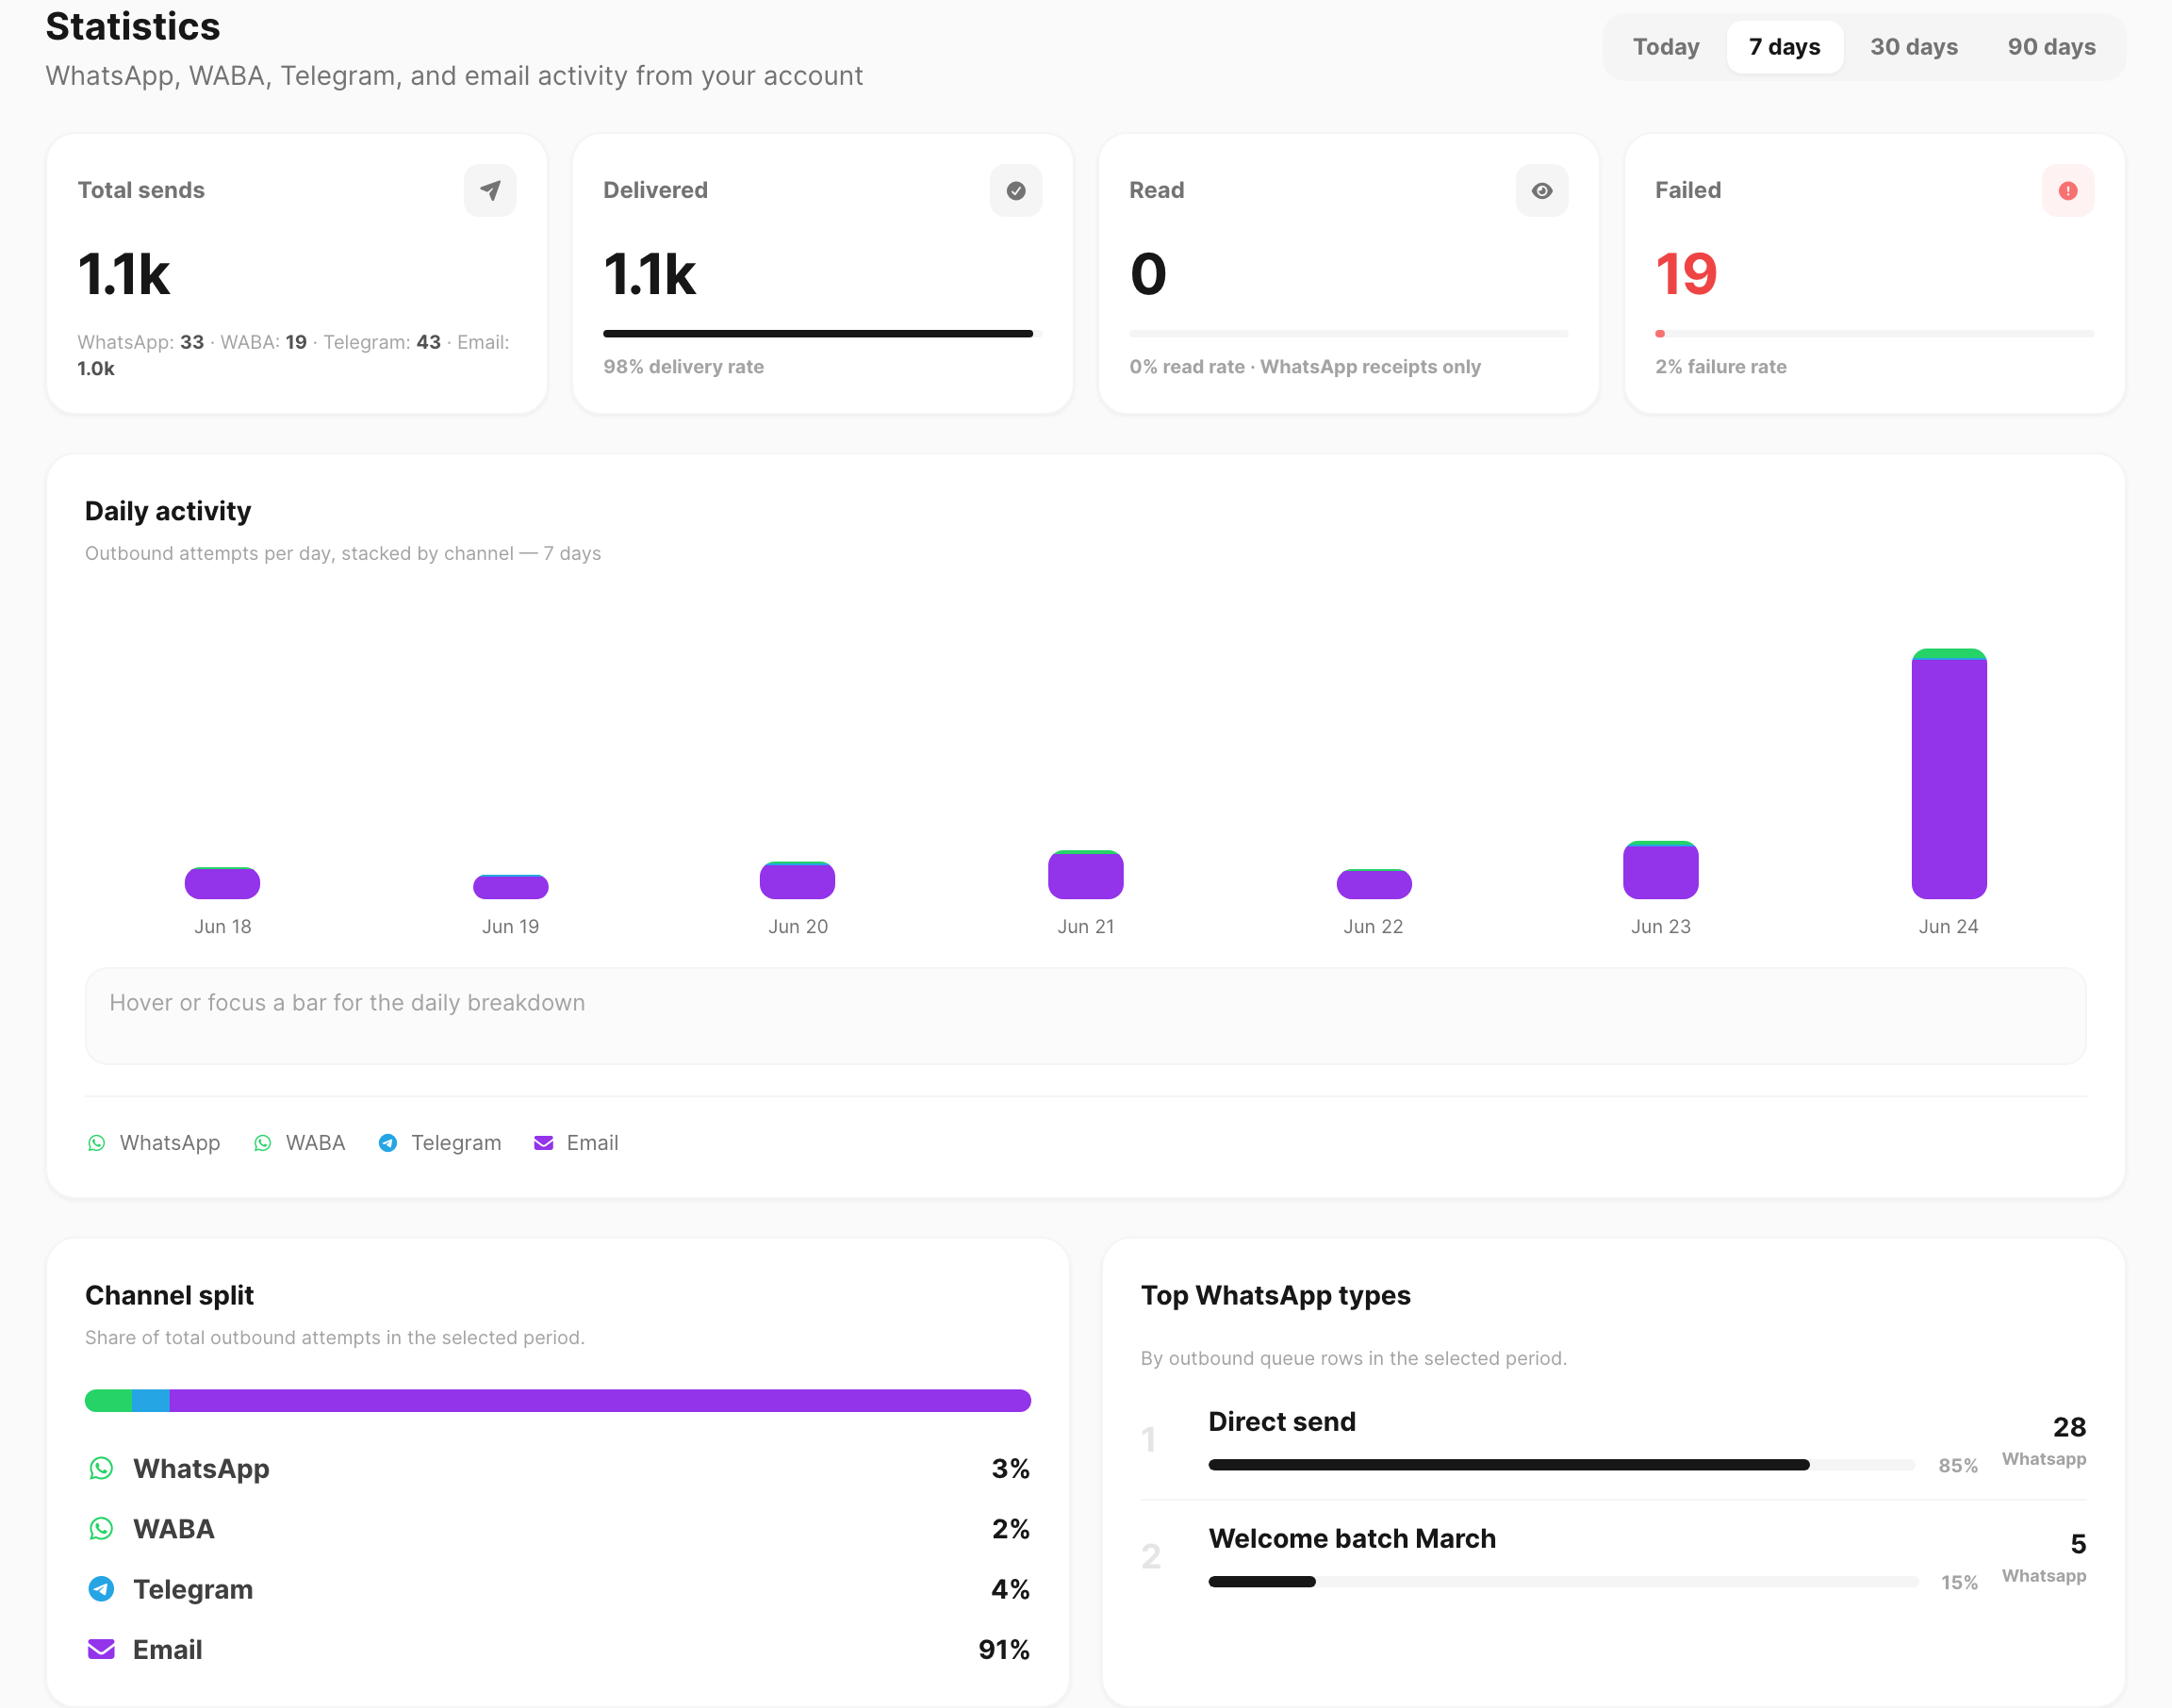
KPI cards
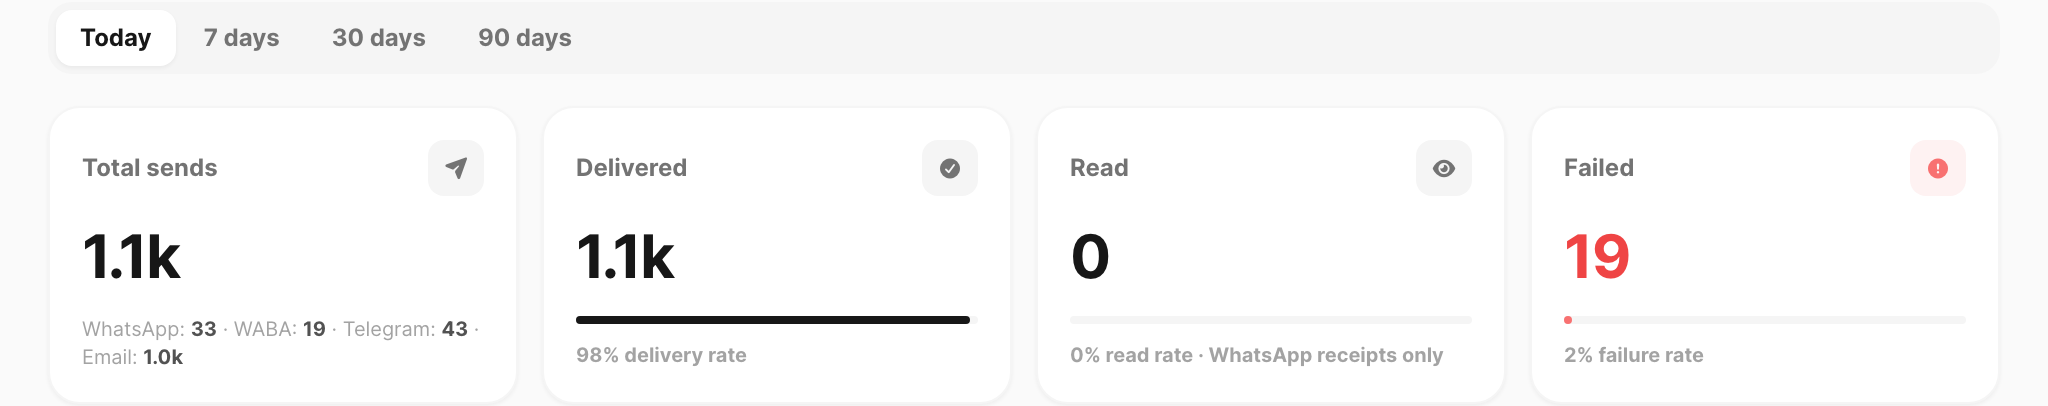
Four cards across the top:
| KPI | Meaning |
|---|---|
| Total sends | Every outbound attempt in the window — WhatsApp, WABA, Telegram, and email combined. The subtitle shows each channel’s count. |
| Delivered | Sends recorded as sent, with a delivery rate bar |
| Read | WhatsApp read receipts when available (often 0 if receipts are not tracked) |
| Failed | Sends with failed or partial status, with a failure rate bar |
Total sends includes failed attempts. A high volume with a low delivery rate usually points to device connection, quota, or template issues — open the relevant channel log for row-level errors.
Numbers of 1.1k or higher are shortened on the card (for example 1,104 appears as 1.1k). Hover the daily chart breakdown for exact counts.
Daily activity
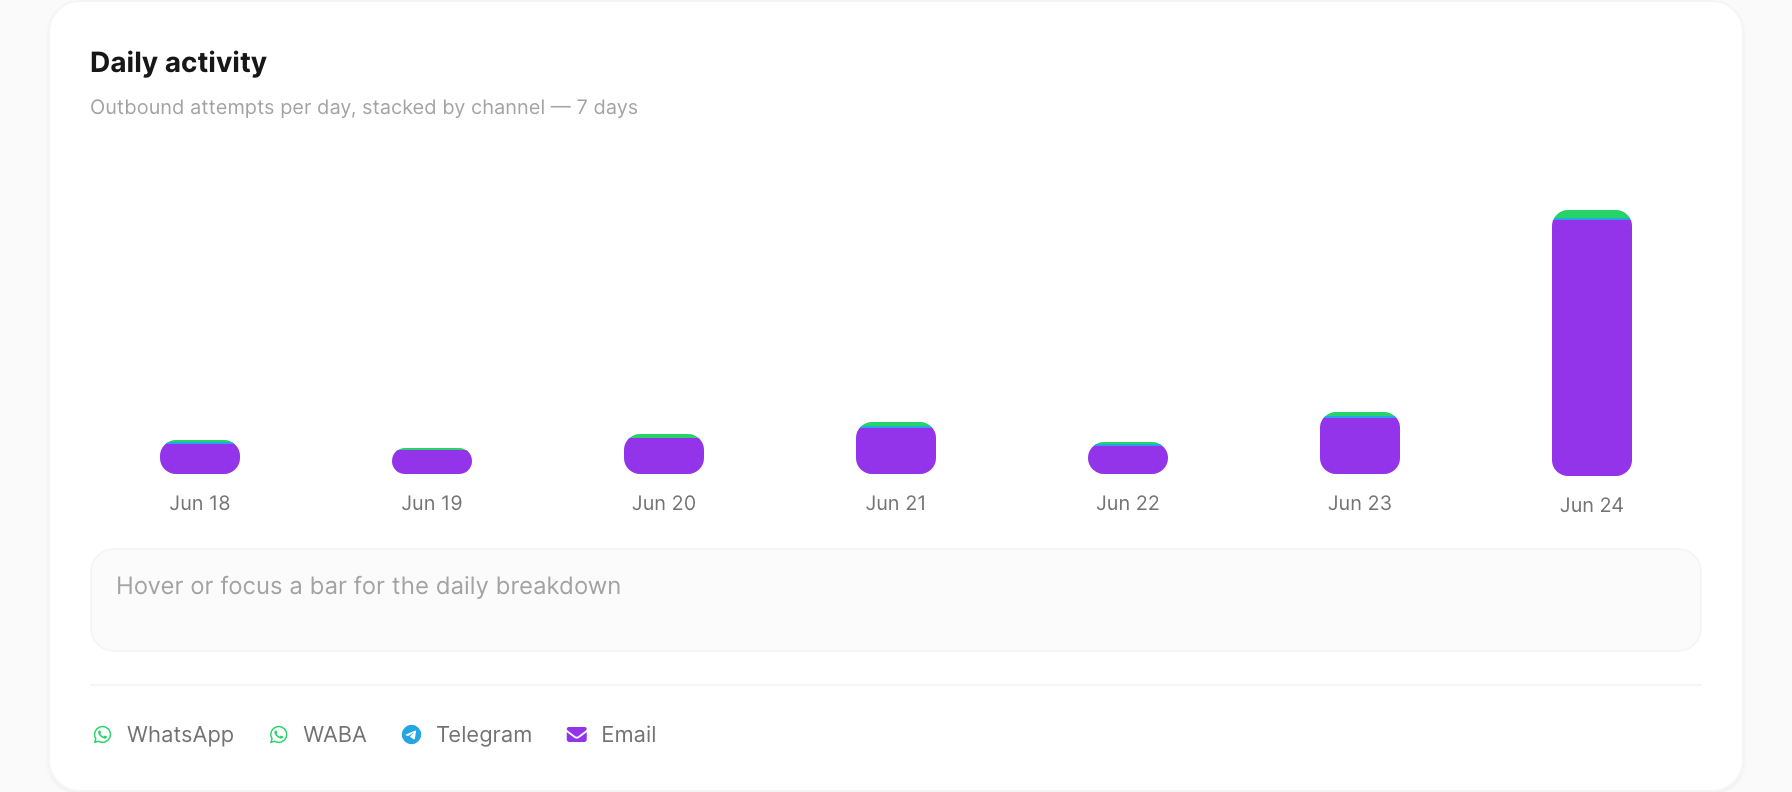
Stacked bars show outbound attempts per UTC day, split by channel:
| Segment | Channel |
|---|---|
| Green (WhatsApp icon) | |
| Dark green | WABA |
| Blue | Telegram |
| Indigo |
Hover or focus a bar to see the day total and per-channel counts in the panel below the chart. A count also appears above the bar while you hover.
On 30 days or 90 days, the chart scrolls horizontally and shows spaced date labels. The page opens scrolled to today (the rightmost bar).
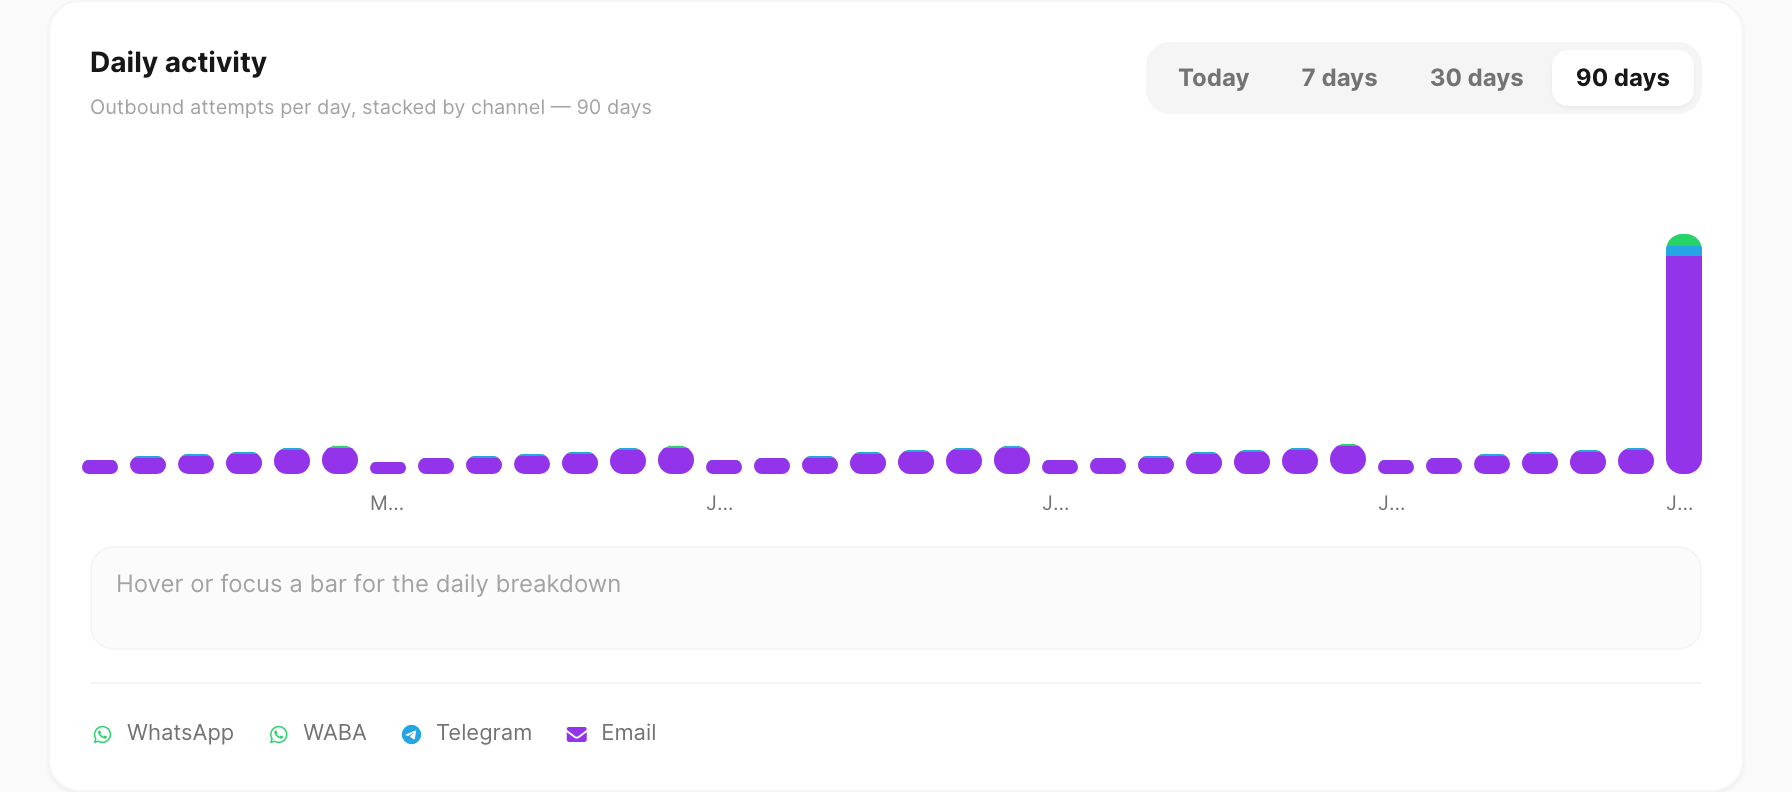
When there is no activity in the window, the chart shows No message activity in this period.
Channel split
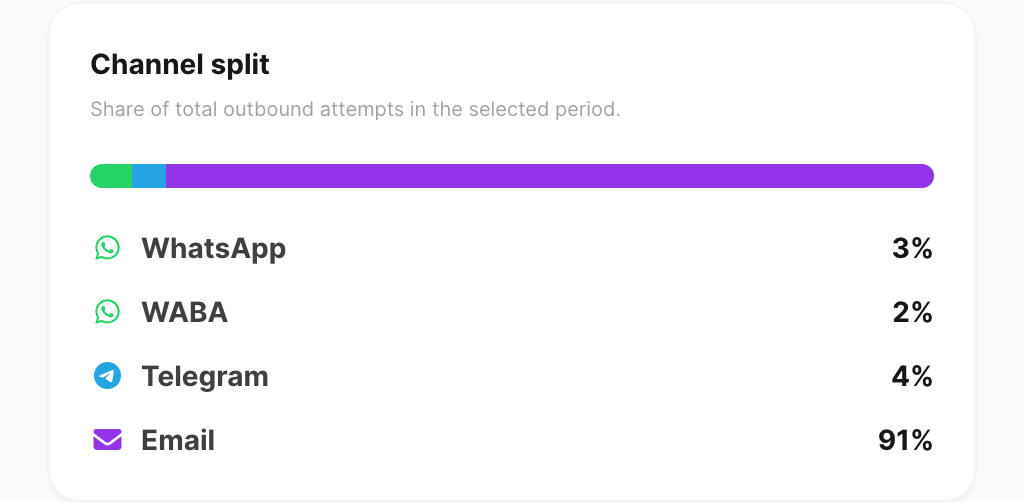
A horizontal bar and list show each channel’s share of total sends in the selected window. Percentages add up to 100% when all four channels have activity.
Top WhatsApp types
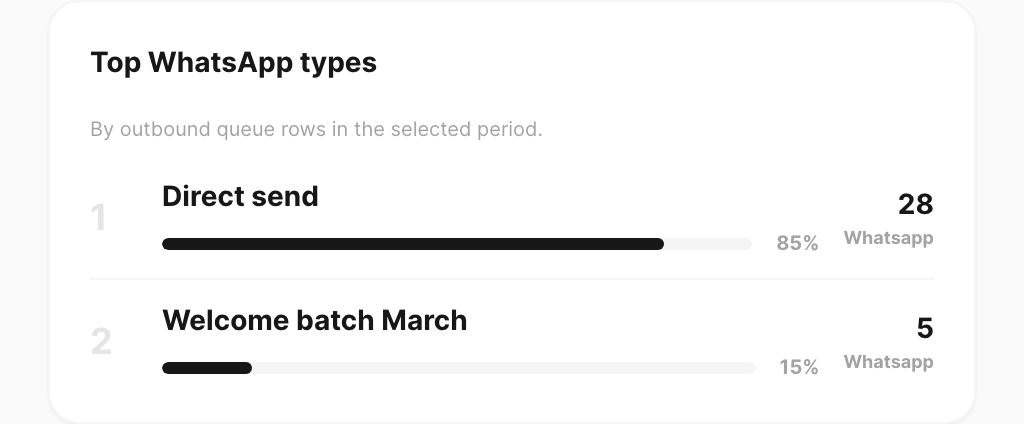
Ranked list of Direct send vs named Campaign batches from WhatsApp outbound rows in the period, with share of WhatsApp volume and total count.
This panel counts WhatsApp only. Email engagement (opens, clicks, bounces) lives on Channel → Email → Statistics, not on this page.
Per-channel statistics
The same KPI layout for one channel only is under:
| Page | Sidebar path |
|---|---|
| WhatsApp statistics | Channel → WhatsApp → Statistics |
| WABA statistics | Channel → WABA → Statistics |
| Telegram statistics | Channel → Telegram → Statistics |
| Email statistics | Channel → Email → Statistics |
Those pages add by device (or by number / by bot) breakdowns and delivered-vs-failed daily charts for that channel alone.
Home dashboard
The Dashboard home screen uses a fixed 7-day window with a similar daily chart and a By channel panel. Open Logs → Statistics when you need Today, 30 days, or 90 days, or the full-page channel split and top WhatsApp types list. See Dashboard tour.
Related
- Message logs — History and per-channel send rows
- Read cross-channel statistics — compare windows and read the daily chart
- Dashboard tour — home dashboard KPIs (7-day view)
- WhatsApp statistics — WhatsApp-only volume and devices
- Email statistics — opens, clicks, and deliverability