Telegram statistics
Outbound volume, delivery rate, and bot breakdown for Telegram sends.
Open Channel → Telegram → Statistics.
What this page is for
Aggregated outbound activity for Telegram only — send volume, delivery and failure rates, daily trends, top send types, and volume per bot.
Use Logs for individual sends. Statistics shows totals and trends for the selected time window.
Sample data shown.
| Header control | What it does |
|---|---|
| View log | Opens Logs for row-level send history |
| Today / 7 days / 30 days / 90 days | Changes the time window for all numbers on the page |
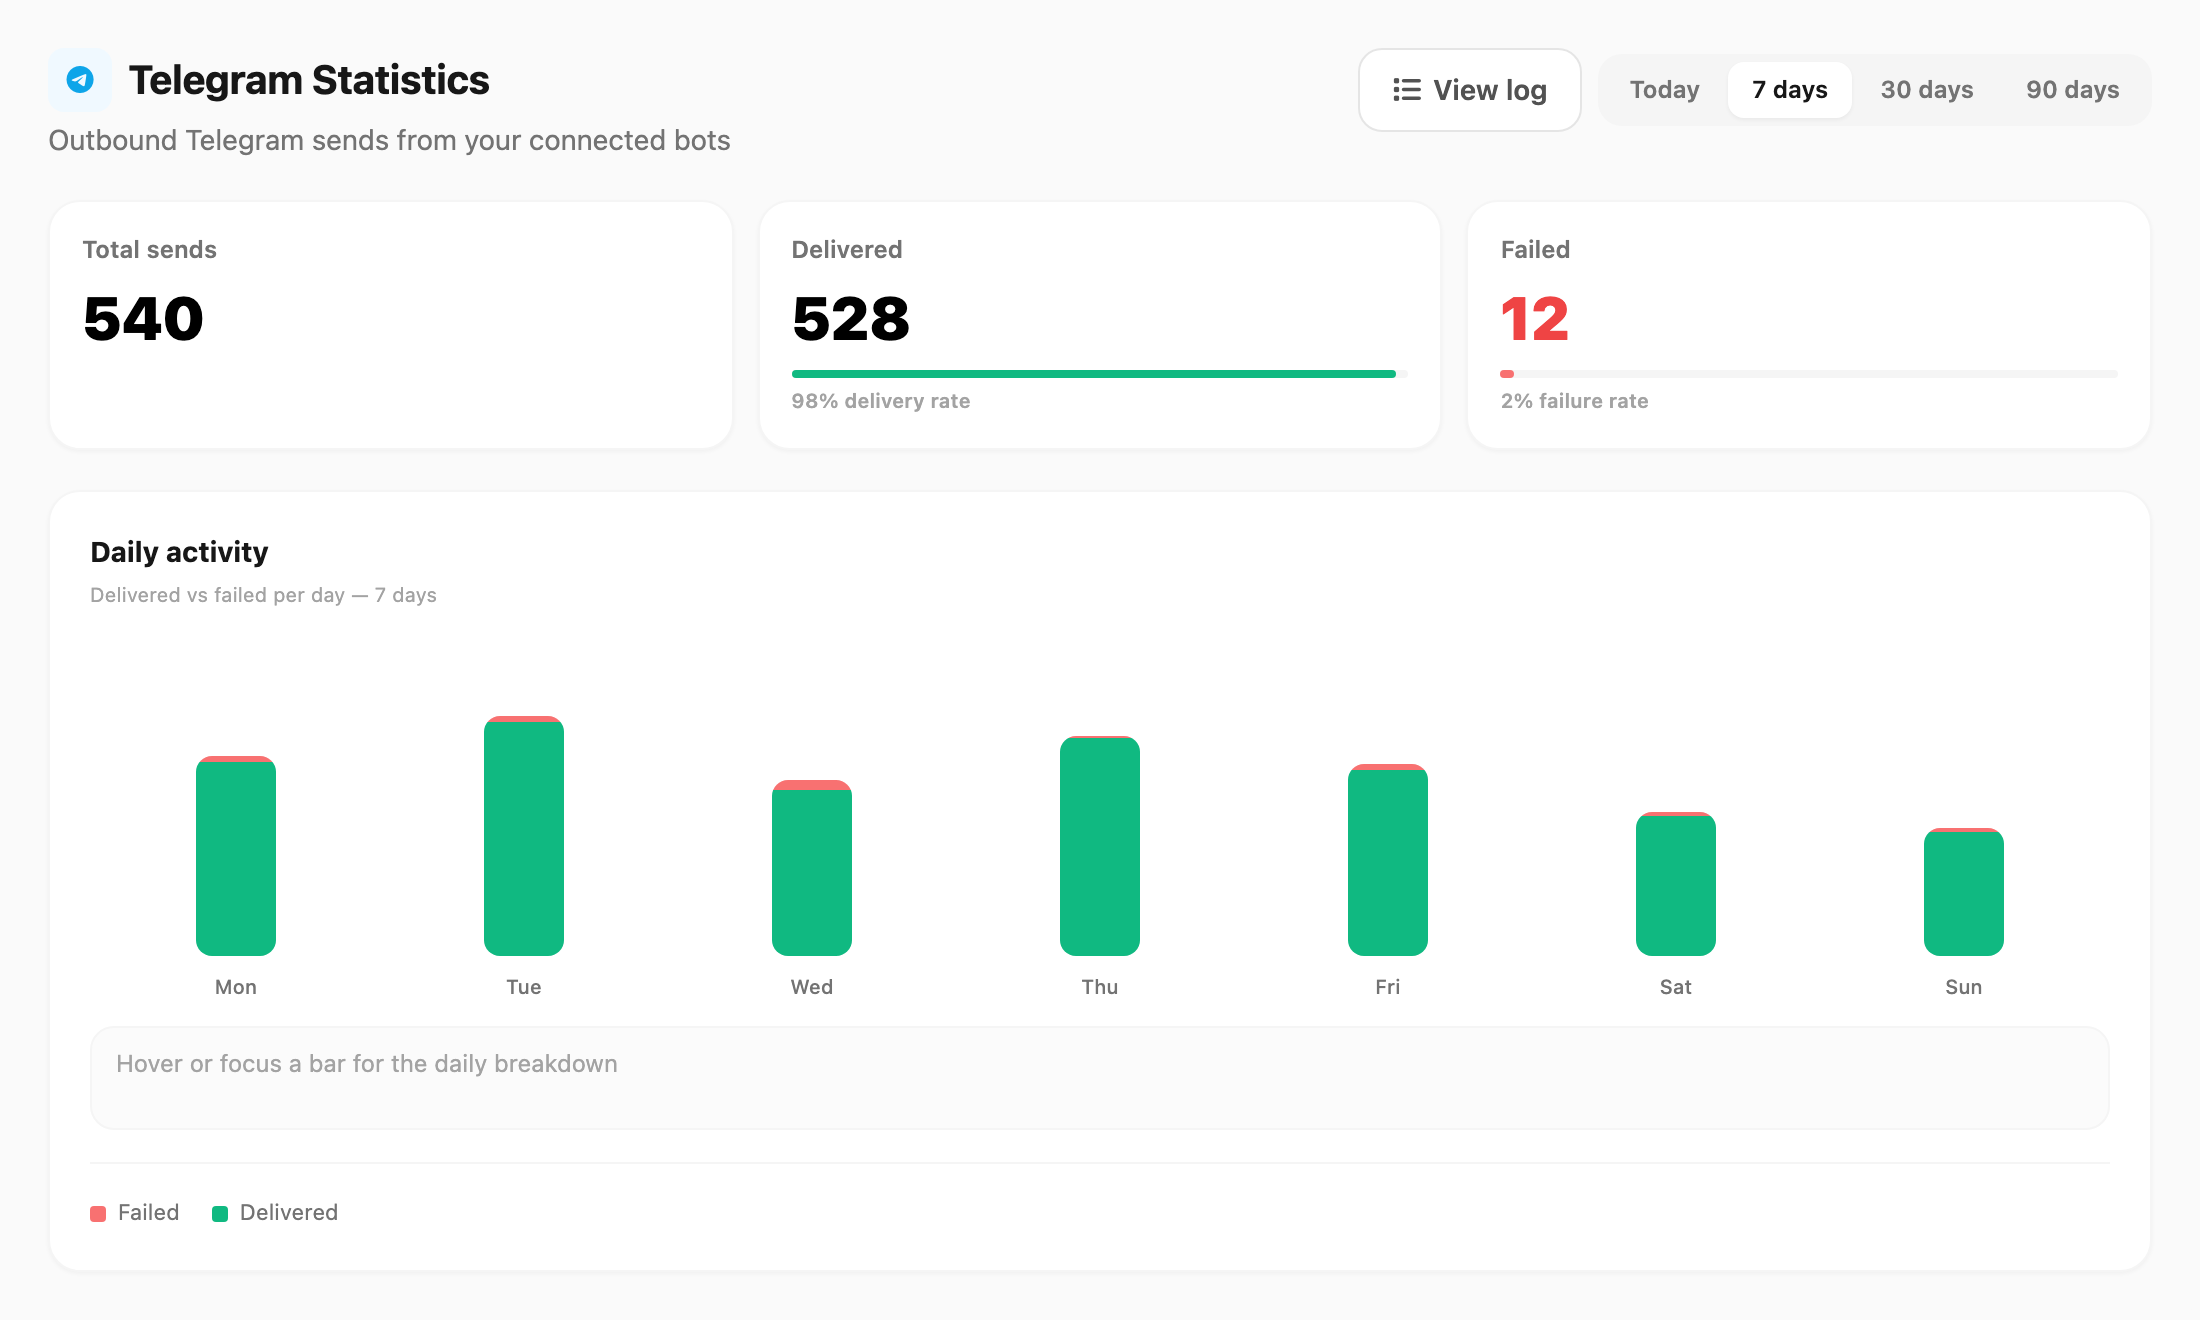
KPI cards
Three cards across the top:
| KPI | Meaning |
|---|---|
| Total sends | Every outbound Telegram attempt in the window |
| Delivered | Sends recorded as successfully delivered — includes a green delivery rate bar |
| Failed | Sends that failed or only partially delivered — includes a red failure rate bar |
Daily activity
Each day is a stacked bar:
| Segment | Color | Position |
|---|---|---|
| Failed | Red | Top of the bar |
| Delivered | Green | Bottom of the bar |
Hover or focus a bar to see the day total and Delivered / Failed counts in the panel below the chart. The legend lists Failed first, then Delivered.
On 30 days or 90 days, the chart scrolls horizontally when there are many bars.
Top send types
Ranked list of Direct send vs named Campaign batches, with share of volume and total count.
By bot
Table of your top Telegram bots by outbound volume:
| Column | Meaning |
|---|---|
| Bot | Connected bot identifier |
| Total | All send attempts from that bot |
| Delivered | Successful sends |
| Failed | Failed or partial sends |
Cross-channel view
For Telegram together with WhatsApp, WABA, and email, open Logs → Statistics or see Statistics.
Related
- Logs — per-send history and search
- Devices — connect and manage bots
- Statistics — Logs → Statistics (all channels)