Email statistics
Deliverability health, bounce and complaint rates, and sending status.
Open Channel → Email → Statistics.
What this page is for
Deliverability health for email — volume, bounce and complaint rates, domain patterns, and whether you can still send.
Use Logs for individual sends (recipient, subject, error text). Statistics shows aggregates and trends.
Sample data shown.
| Header control | What it does |
|---|---|
| Refresh | Reloads all tabs from the server |
Tabs
Four tabs along the top of the page:
| Tab | What it shows |
|---|---|
| Overview | Sending status, recent KPIs, daily volume chart, what to fix, domains with bounces |
| Statistics | All-time totals, daily volume chart, recent sample breakdown, by template type |
| Domain | All-time bounce patterns by recipient domain (@gmail.com, @company.com, …) |
| Health | Last 7 and 30 days deliverability summary and health score |
The Overview tab shows a badge when What to fix has open items.
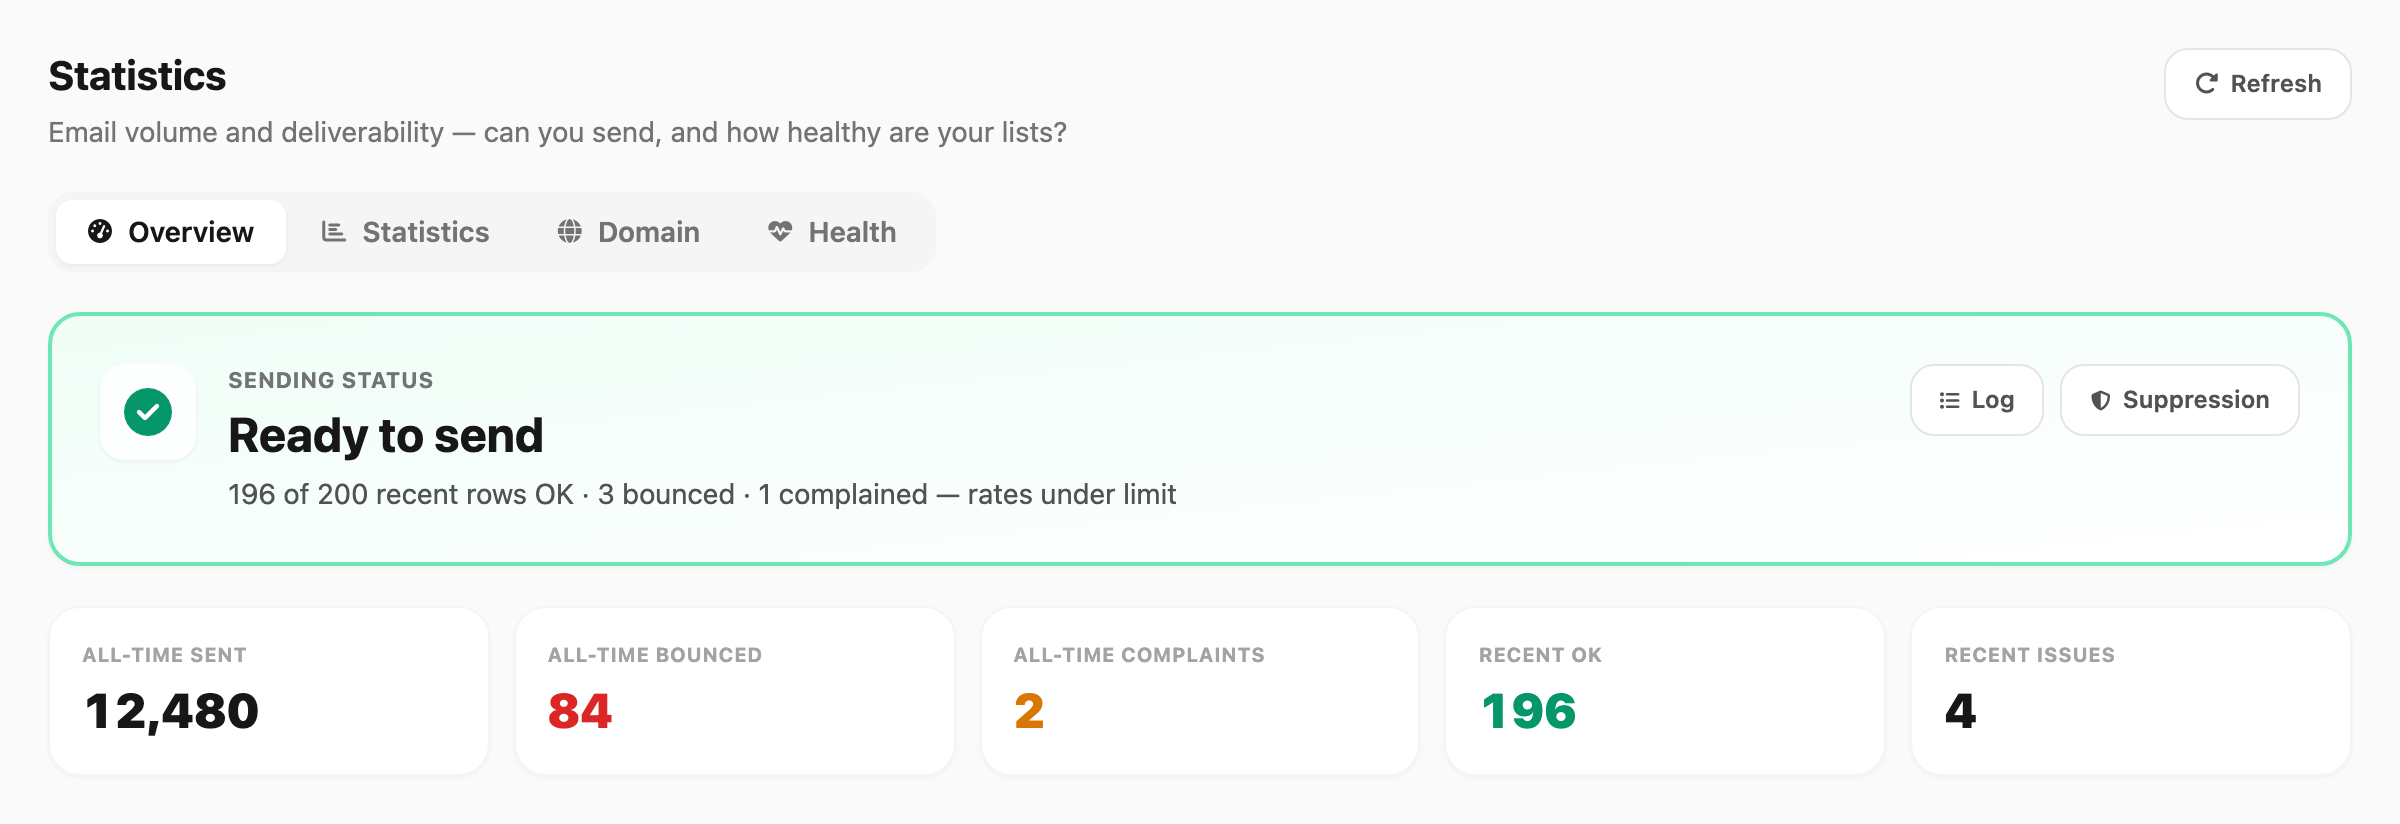
Overview tab
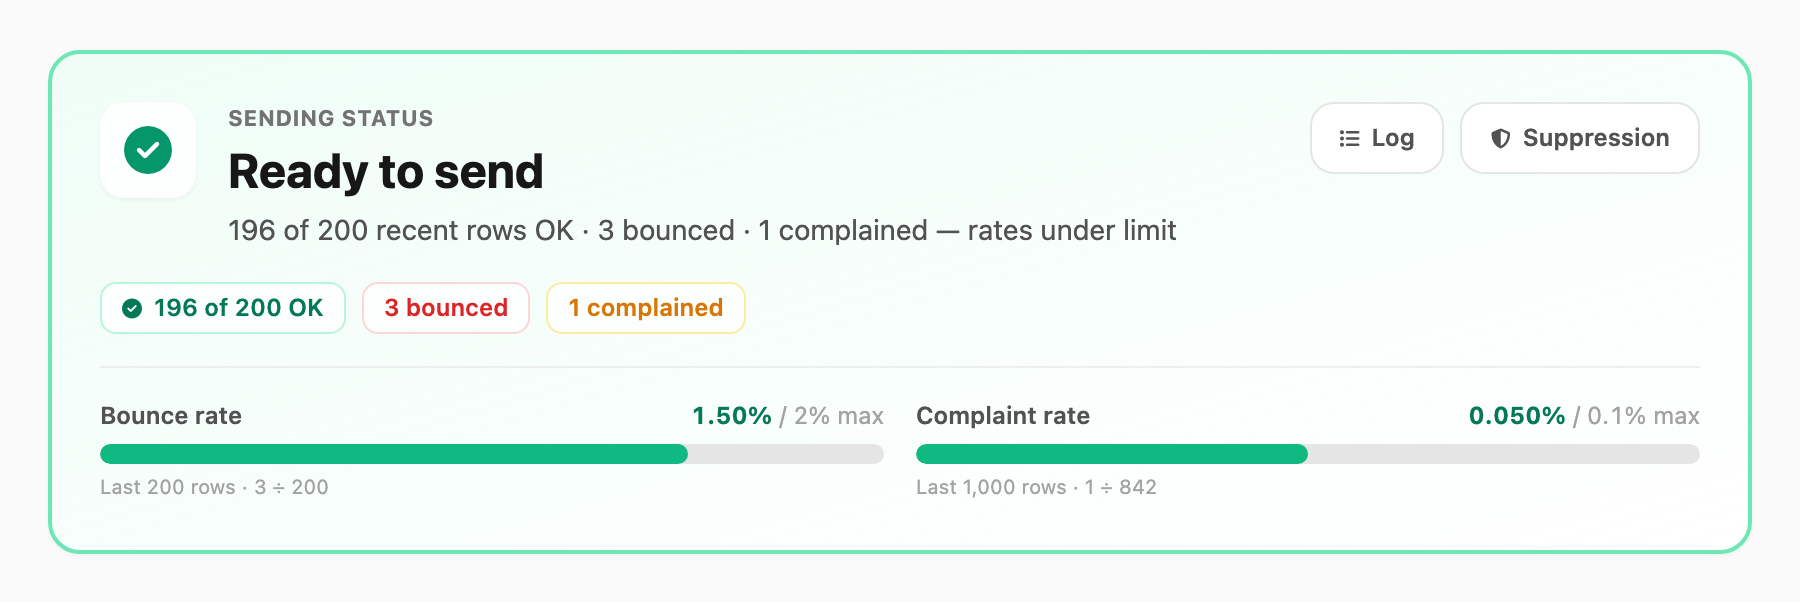
Sending status
The top card answers “Can I send right now?”
| Status | Meaning |
|---|---|
| Ready to send | Recent bounce and complaint rates are under the limits |
| Send with caution | Some bounces or complaints, but not over the limit yet |
| Action required | Bounce or complaint rate is over the limit |
| Sending suspended | Sending is blocked until rates improve or support reinstates you |
Below the headline, progress bars show Bounce rate and Complaint rate against the limits (see Rate limits).
Quick links on the card open Logs and Suppression.
KPI strip
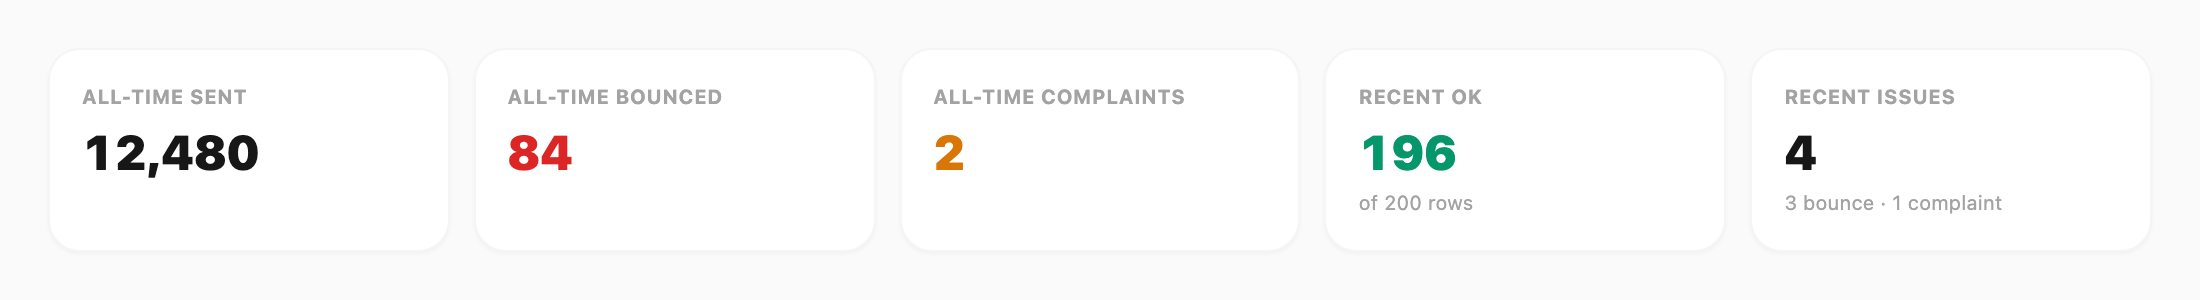
| KPI | Meaning |
|---|---|
| All-time sent | Lifetime successful sends |
| All-time bounced | Lifetime rows recorded as bounced (see Bounced vs failed) |
| All-time complaints | Lifetime spam complaints |
| Recent OK | OK rows in the last-200 sample |
| Recent issues | Bounces + complaints in that same sample |
Daily volume chart
Stacked bars for the last 30 days (also on the Statistics tab):
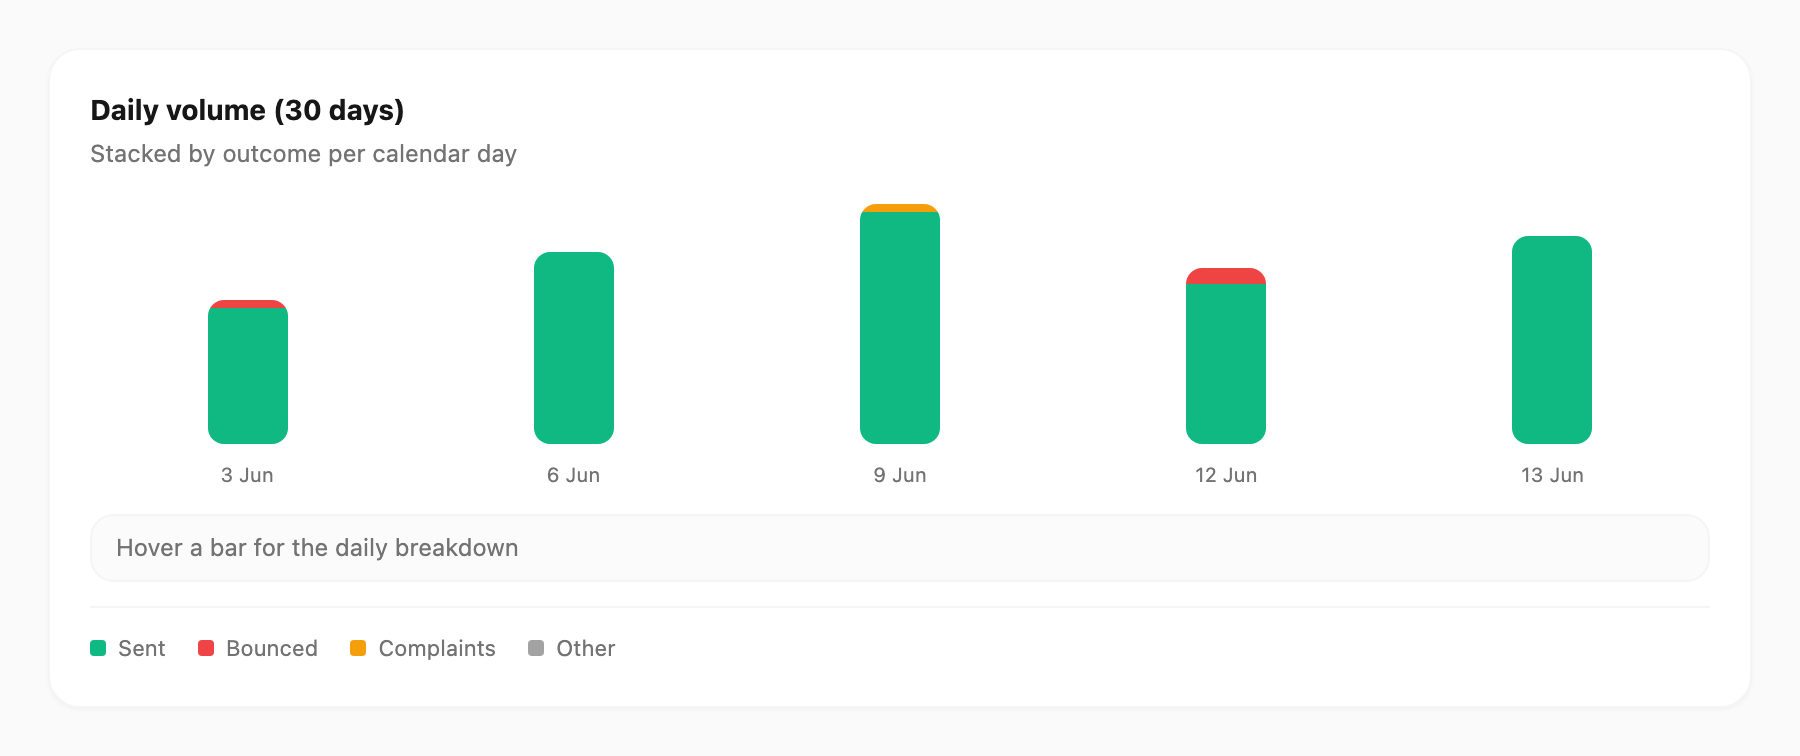
| Segment | Meaning |
|---|---|
| Sent | Delivered / accepted OK |
| Bounced | Status bounced |
| Complaints | Status complained |
| Other | Includes failed and other non-OK statuses |
Hover a bar for the count breakdown for that day.
What to fix
When something needs attention, Kirisan lists issues with a short explanation and a button to Logs or Suppression.
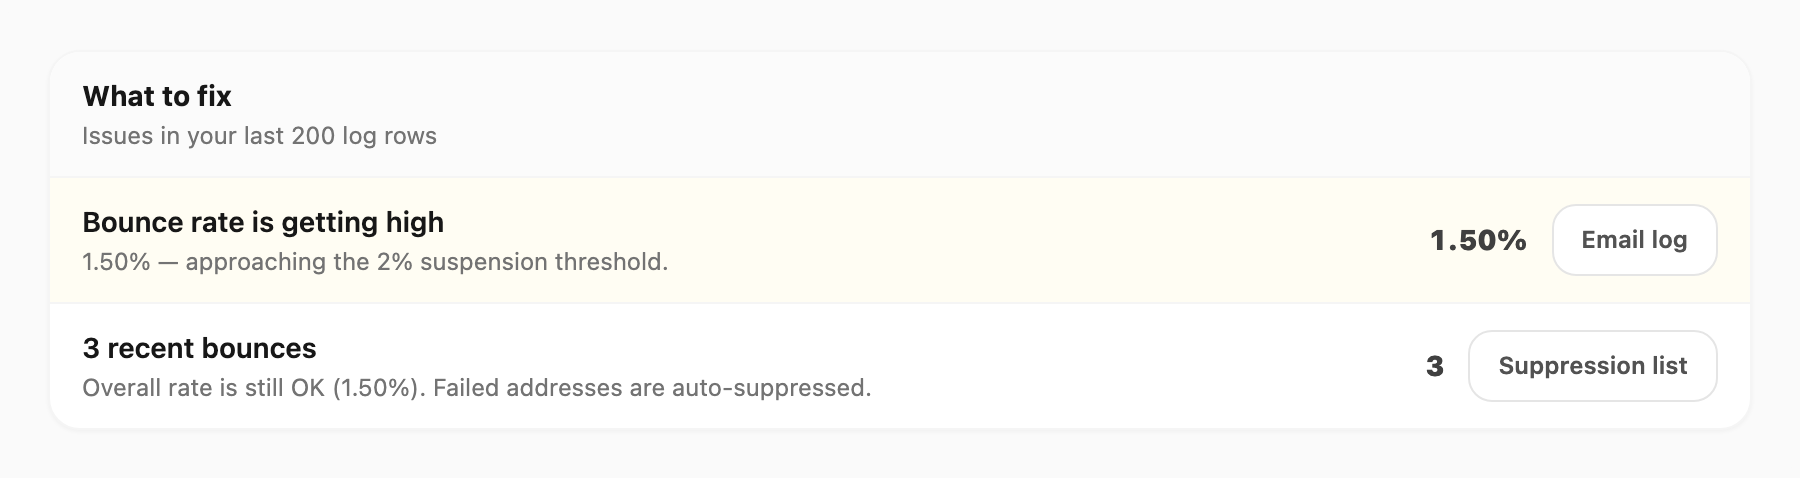
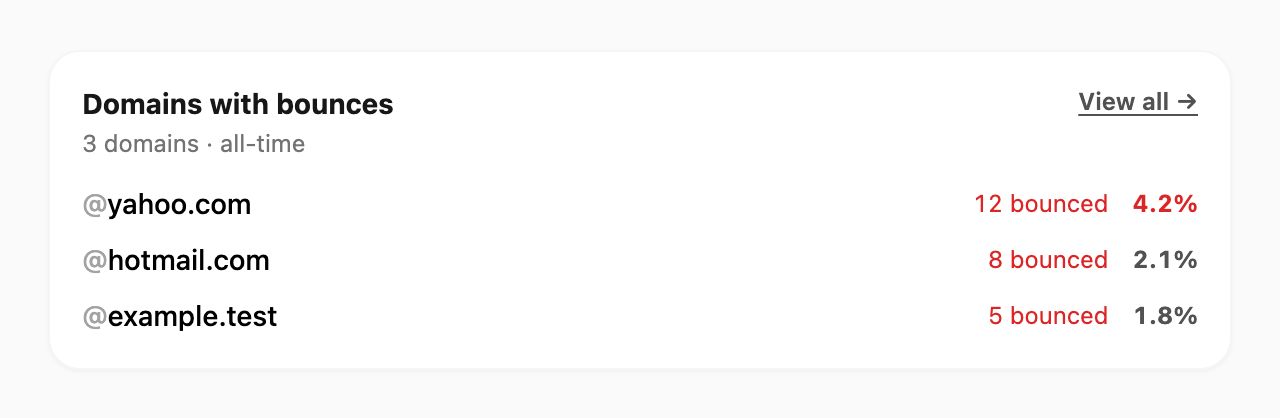
Domains with bounces
Preview of recipient domains with the most all-time bounces. Click View all → to open the Domain tab.
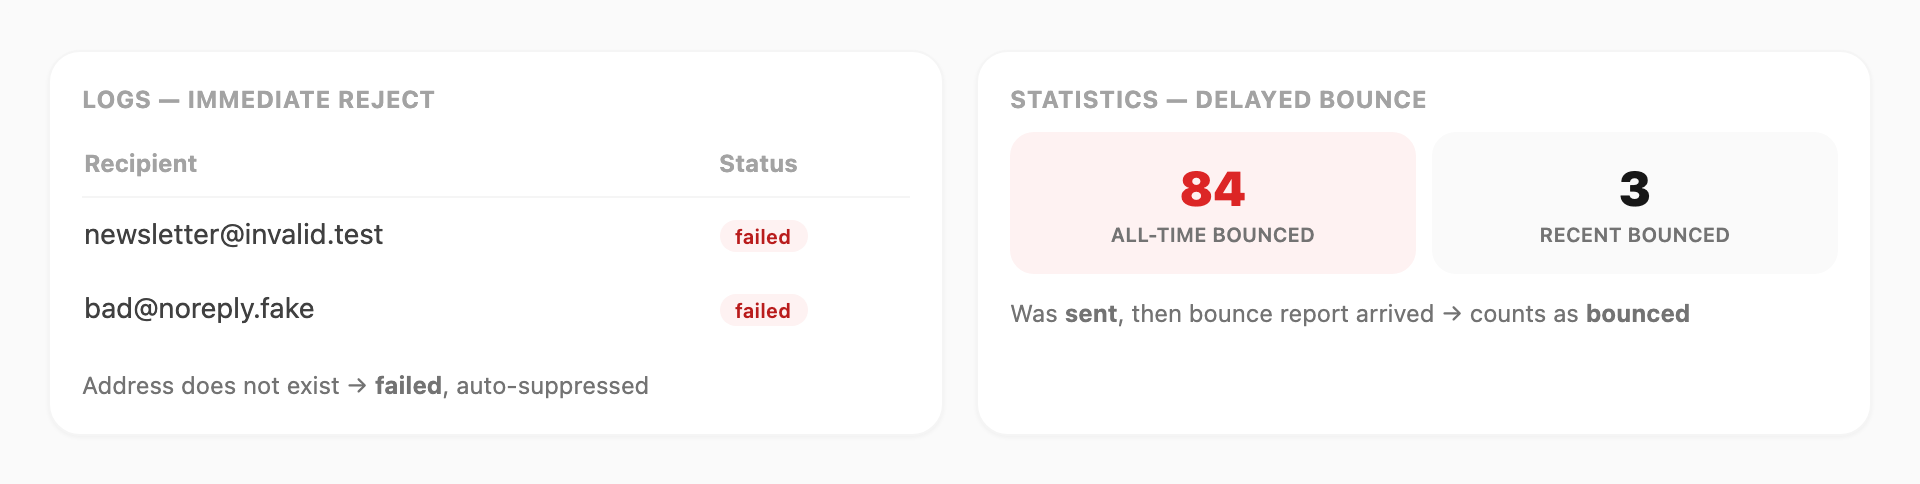
Bounced vs failed
Statistics and Logs use different labels for delivery problems. Both can add addresses to Suppression.
| Outcome | What happened | Statistics | Logs |
|---|---|---|---|
| Sent | Accepted by the recipient’s mail server | OK in recent sample | sent |
| Failed | Rejected immediately (bad address, SMTP error) | Not counted as bounced — appears in chart Other | failed — filter Failed |
| Bounced | Was sent, then a bounce report arrived later | Counts toward Bounced and bounce rate | May still show sent |
| Complained | Recipient clicked Report spam | Counts toward Complained and complaint rate | — |
| Suppressed | Blocked before send | Not included in rate calculations | — |
Typical “email doesn’t exist” case: Kirisan rejects at send time → failed in Logs and the address is auto-suppressed, but Statistics Bounced does not increase unless a later bounce report is recorded as bounced.
That is why Failed in Logs can be high while Statistics Bounced stays low.
Statistics tab
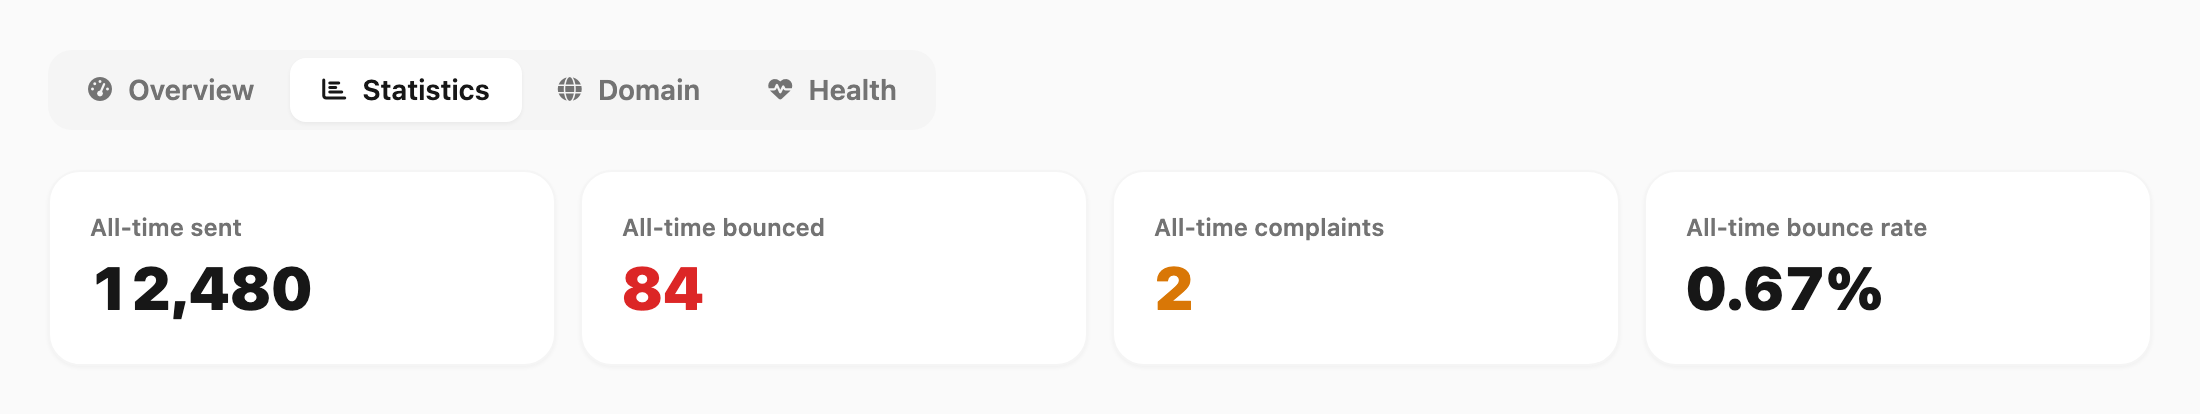
All-time cards
Four cards at the top: All-time sent, All-time bounced, All-time complaints, and All-time bounce rate.
Recent sample
Breakdown of your last 200 log rows (newest first) — the same window used for bounce auto-suspension:
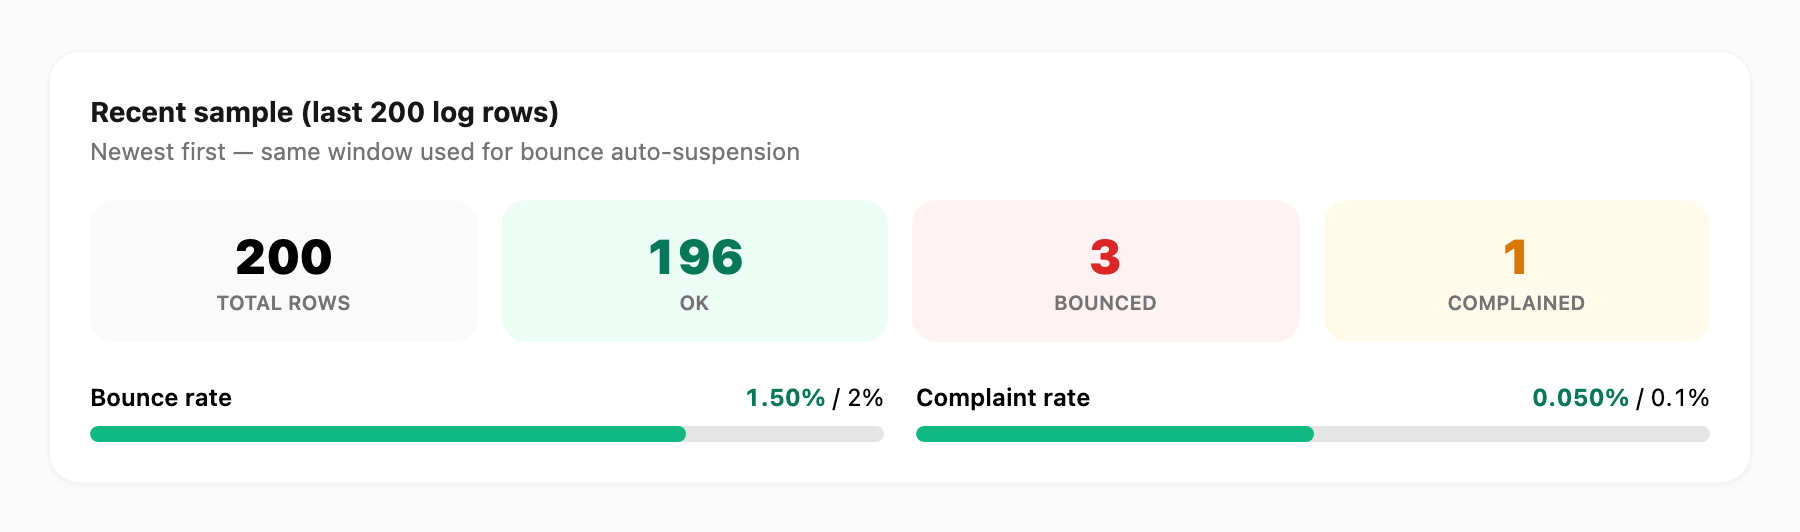
| Tile | Meaning |
|---|---|
| Total rows | Rows in the sample |
| OK | Not bounced or complained |
| Bounced | Bounced rows in this window |
| Complained | Complaint rows in this window |
Progress bars below show Bounce rate and Complaint rate vs the limits.
The Daily volume (30 days) chart also appears on this tab — same as on Overview (see Daily volume chart).
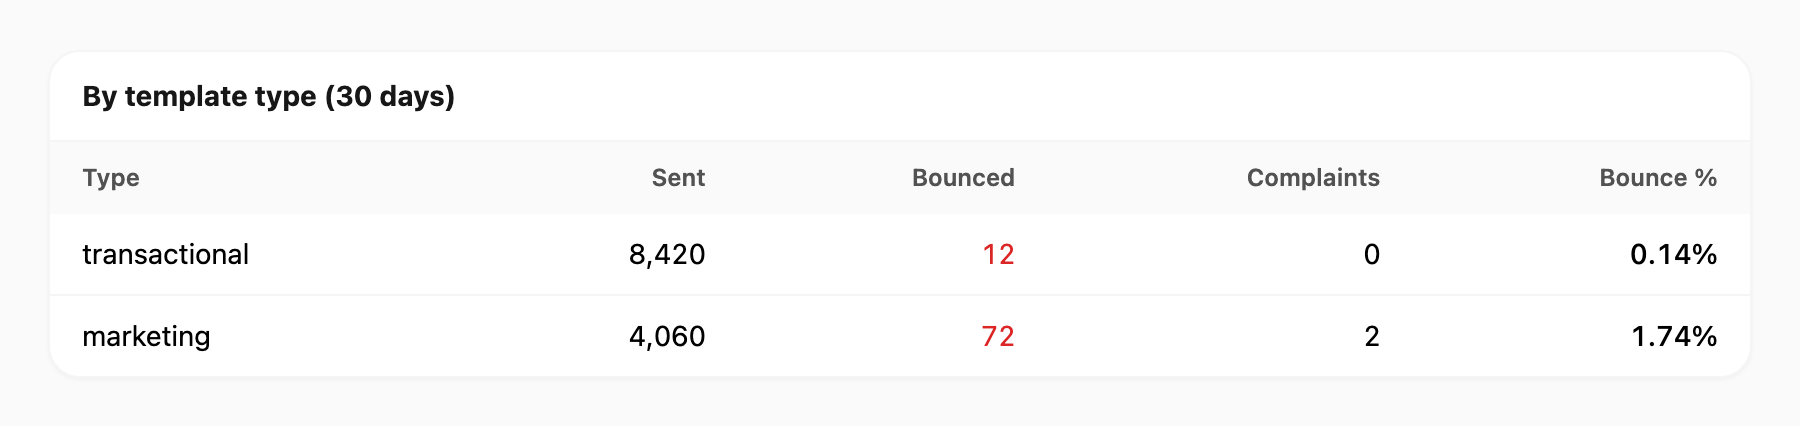
By template type (30 days)
Table of sends, bounces, complaints, and bounce % grouped by email template type (when data exists).
Domain tab
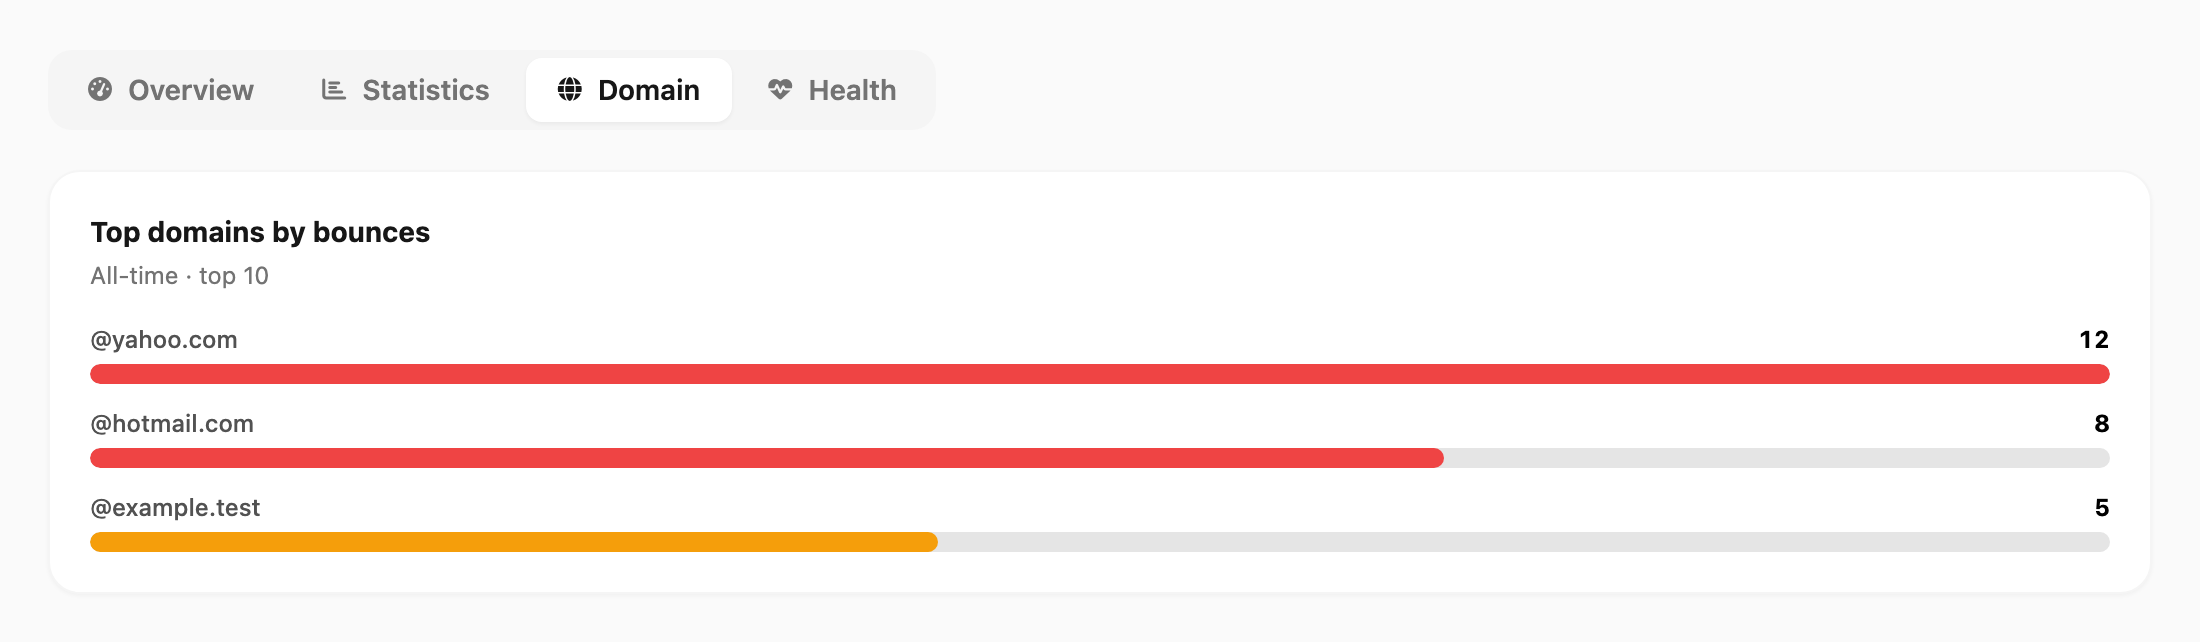
All-time table of recipient domains:
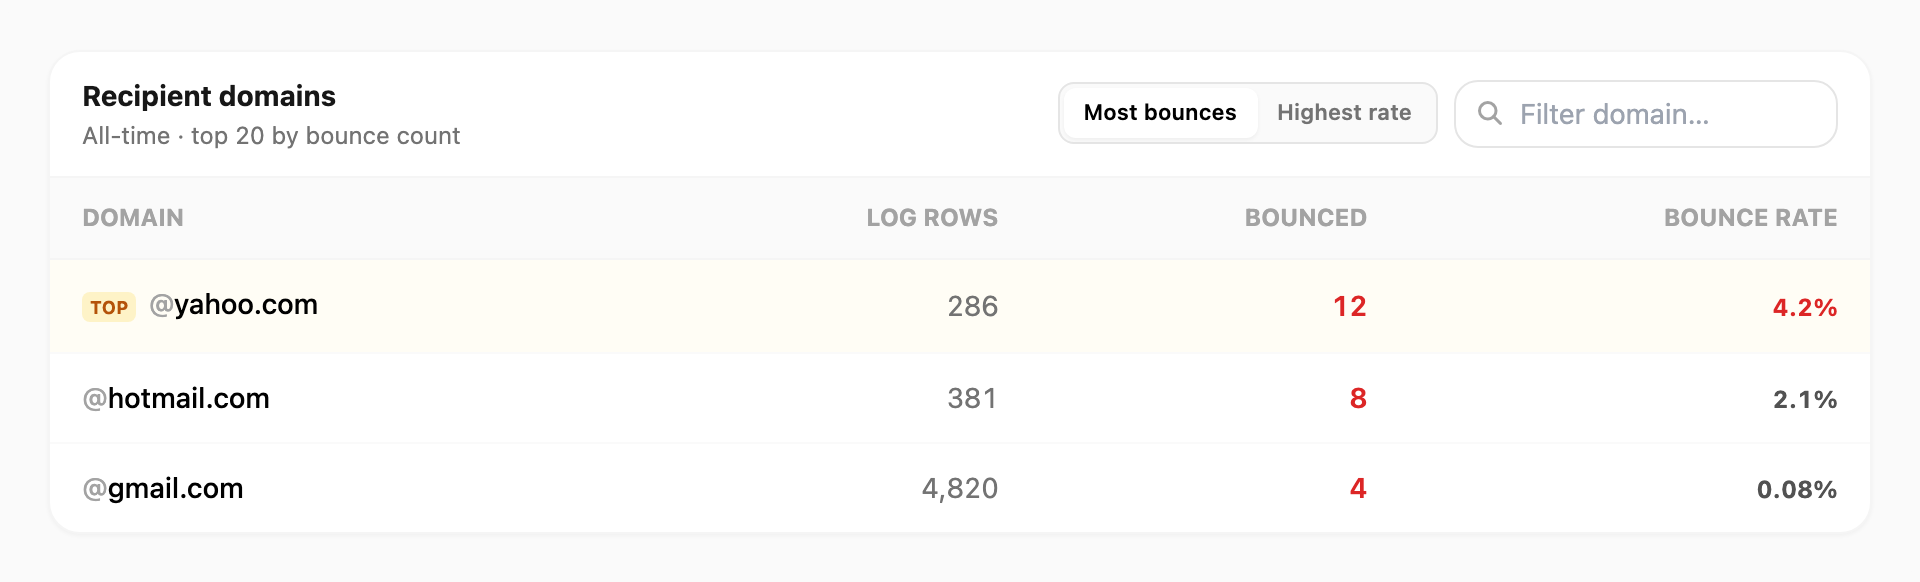
| Column | Meaning |
|---|---|
| Domain | Part after @ in the recipient address |
| Log rows | All-time send rows to that domain |
| Bounced | All-time bounces to that domain |
| Bounce rate | Bounced ÷ log rows |
| Control | What it does |
|---|---|
| Most bounces / Highest rate | Sort order |
| Filter domain… | Search box — narrows the table |
A bar chart above the table shows the top 10 domains by bounce count when data exists.
Historical domain patterns do not by themselves change Sending status on Overview if your recent sample is clean.
Health tab
Calendar-based deliverability (last 7 and 30 days):
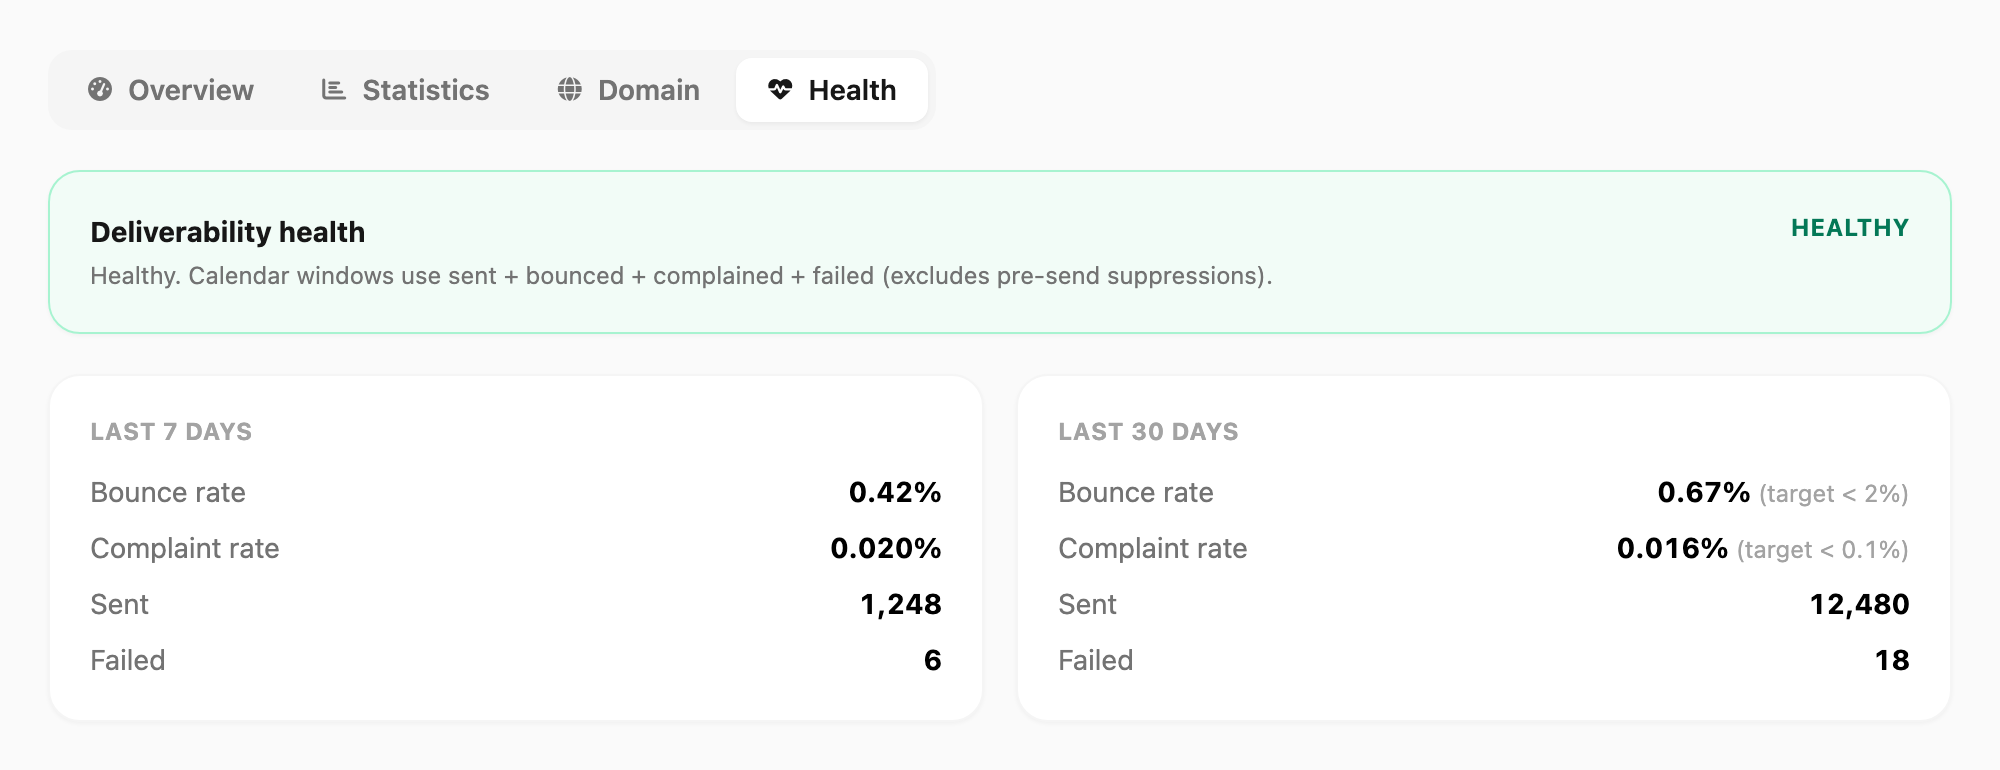
| Field | Meaning |
|---|---|
| Bounce rate | Bounced ÷ (sent + bounced + complained + failed) in the window |
| Complaint rate | Complained ÷ same denominator |
| Sent | Successful sends in the window |
| Failed | Immediate send failures in the window |
| Suppressed (pre-send) | Blocked before SMTP — excluded from the rate denominator |
Health uses date ranges. Overview sending status uses send-count windows (last 200 / 1,000 rows) for suspension logic.
Rate limits
Kirisan may suspend sending when recent rates exceed:
| Metric | Limit | Sample |
|---|---|---|
| Bounce rate | 2% | Last 200 log rows (minimum 50 sends) |
| Complaint rate | 0.1% | Last 1,000 log rows (minimum 500 sends) |
Examples:
- 4 bounces in the last 200 sends = 2% — at the bounce limit.
- 1 complaint in 1,000 sends = 0.1% — at the complaint limit; 2 complaints = 0.2% — over the limit.
Failed addresses from bounces and complaints are auto-suppressed so you do not mail them again.
Tips
- Use Overview for “can I send?” and Health for “how did the last 30 days look?”
- Bad addresses rejected at send time → filter Failed on Logs, not Bounced on Statistics.
- After a bounce or complaint spike, check Suppression before your next campaign.
- Domain tab is all-time — a clean Overview can coexist with old bounces on one domain.
- Click Refresh after fixing list quality to update rates.
Cross-channel view
For email together with WhatsApp, WABA, and Telegram, open Logs → Statistics or see Statistics.
Related
- Statistics — Logs → Statistics (all channels)
- Logs — per-send sent / failed history and search
- Suppression — blocked recipients
- Domains — verified sending domains and Sending health